Profitability Bar-Chart
The Profitability Bar-Chart is obtained by clicking on the Profitability Bar Chart option in the Reports Menu in the Project Listing page.
(Click here to see a picture of the menu location)
Access Right: Project Profitability View in Web
The Project Profitability Barc Chart is only available if the Project Management module is installed.
Purpose
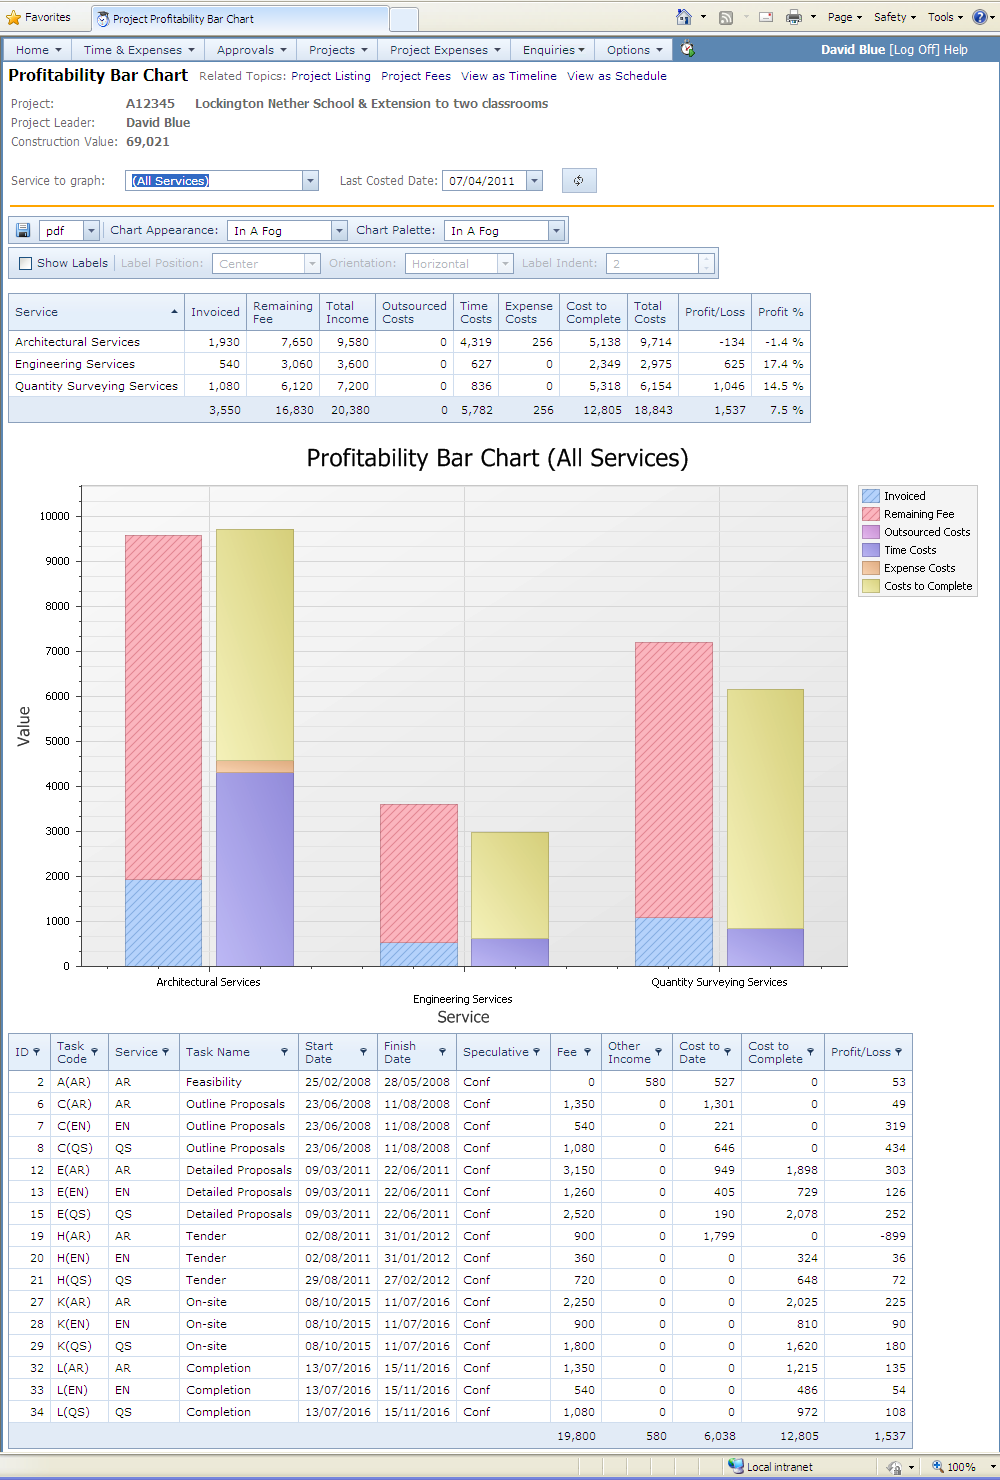
The Profitability Bar-Chart provides a breakdown of predicted profitability by service and task. The bar-chart may be produced for the whole project, and shows a separate income vs costs bar chart for each service.
This topic contains
• Instructions on how to operate the profitability bar-chart
| • | Screenshot of the profitability bar-chart graph |
| • | An explanation of how profitability is calculated |
Operation
To access the profitability bar-chart, select the Profitability Bar Chart option under the Reporting menu in the Project Listing page. To obtain the Project Listing page, select the Project Listing option from the top Projects menu.
The bar chart is available for a selected service on a project or for the project overall. This is controlled by the Service to Graph drop-down.
The Last Costed Date date defines the effective date at which costs are taken from the timesheets or forecasted costs. For example, a date of 31-Jan-11 indicates that actual costs are taken from timesheets prior to 31-Jan-11 and costs after 31-Jan-11 are taken from the forecast.
If either the Service or Last Costed Date is change you need to click the Refresh button ![]() to refresh the graph.
to refresh the graph.
The colours and style of the graph can be changed using the Chart Appearance and Chart Palette options above the graph.
Related links at the top allow you to also view this information as a monthly schedule or a time-line graph.
Screenshot
Calculation Logic
More detail on how profitability is calculated is given in the topic: How Income and Cost Profiles are Calcualted.
Service Table (above the graph)
Service
|
The service the graph has been plotted for |
||||
Invoiced |
Value of invoices up to the Last Costed Date. Invoices include all income: fees, time-charges and expenses/disbursements. |
||||
Remaining Fee
|
The remaining fixed fee after deducting the fees invoiced |
||||
Total Income
|
Invoiced + Remaining Fee |
||||
Outsourced Costs |
The value of outsourced fees. This is the total value of purchase orders entered for outsourced fees. |
||||
Time Costs |
The value of timesheets (at the resource cost rate) up to and including the Last Costed Date.
|
||||
Expenses Costs |
The value of expenses up to and including the Last Costed Date. This does not include actual costs for outsourced fees. |
||||
Cost to Complete
|
Time: The cost to complete for time related costs is taken from one of: • Resource Plans for tasks set for resource planning
Expenses: For each service the percentage of non-chargeable expenses (entered on the service fees page) is applied to the time costs to complete.
|
||||
Total Costs |
Outsourced Costs + Time Costs + Expense Costs + Cost to Complete
|
||||
Profit/Loss |
Total Income – Total Costs
|
||||
Profit % |
Profit/Loss x 100% / Total Income
|
Tasks Table (below the graph)
ID |
Defines the planning order of the task |
||||
Task Code |
Task Code |
||||
Task Name |
Name of the task |
||||
Start Date |
Target start date for the task |
||||
Finish Date |
Target finish date for the task |
||||
Speculative |
Defines whether the task is speculative or not: Spec = Speculative Conf = Confirmed |
||||
Fee |
The fixed fee allocated to the task |
||||
Other Income |
Income from time-charges and expenses up to the Last Costed Date. |
||||
Cost to Date |
Time and expense costs up to the Last Costed Date.
|
||||
Cost to Complete |
Time: The cost to complete for time related costs is taken from one of: • Resource Plans for tasks set for resource planning
Expenses: For each service the percentage of non-chargeable expenses (entered on the service fees page) is applied to the time costs to complete.
|
||||
Profit/Loss |
Fee + Other Income – Cost to Date – Cost to Complete
|
||||
Outsourced Fees |
Costs against outsourced fees are kept on a separate line. For some organisations, this could be distributed across tasks but many organisations do not carry out this step, especially for older projects, so it is more reliable to keep this value separated. For outsourced fees the cost is split between already paid in the Cost to Date and remaining outsourced fees in Cost to Complete columns. |