Profitability Schedule
The Profitability Schedule is obtained by clicking on Profitability Schedule option in the Reports menu within the Projects Listing page.
(Click here to see a picture of the menu location)
Access Right: Project Profitability View in Web
The Project Profitability Timeline Graph is only available if the Project Management module is installed.
Purpose
The Profitability Schedule provides an analysis of profit and loss for a service within a project on a monthly basis.
This topic contains
• Instructions on how to operate the Profitability Schedule
| • | Screen shot of the Profitability Schedule |
| • | An explanation of how profitability is calculated |
Operation
To access the profitability schedule, Select the Profitability Schedule option under the Reporting menu in the Project Listing page. To obtain the Project Listing page, select the Project Listing option from the top Projects menu.
The bar chart is available for a selected service only and not for the project overall. This is controlled by the Service to Graph drop-down. If the project only has one service allocated then the schedule will be drawn automatically without having to wait for the refresh.
The Last Costed Date date defines the effective date at which costs are taken from the timesheets or forecasted costs. For example, a date of 31-Jan-11 indicates that actual costs are taken from timesheets prior to 31-Jan-11 and costs after 31-Jan-11 are taken from the forecast.
If either the Service or Last Costed Date is change you need to click the Refresh button ![]() to refresh the graph.
to refresh the graph.
The colours and style of the graph can be changed using the Chart Appearance and Chart Palette options above the graph.
Related links at the top allow you to also view this information as a monthly schedule or a time-line graph.
To create a print of the schedule, click the Printer Friendly button.
Sample Report
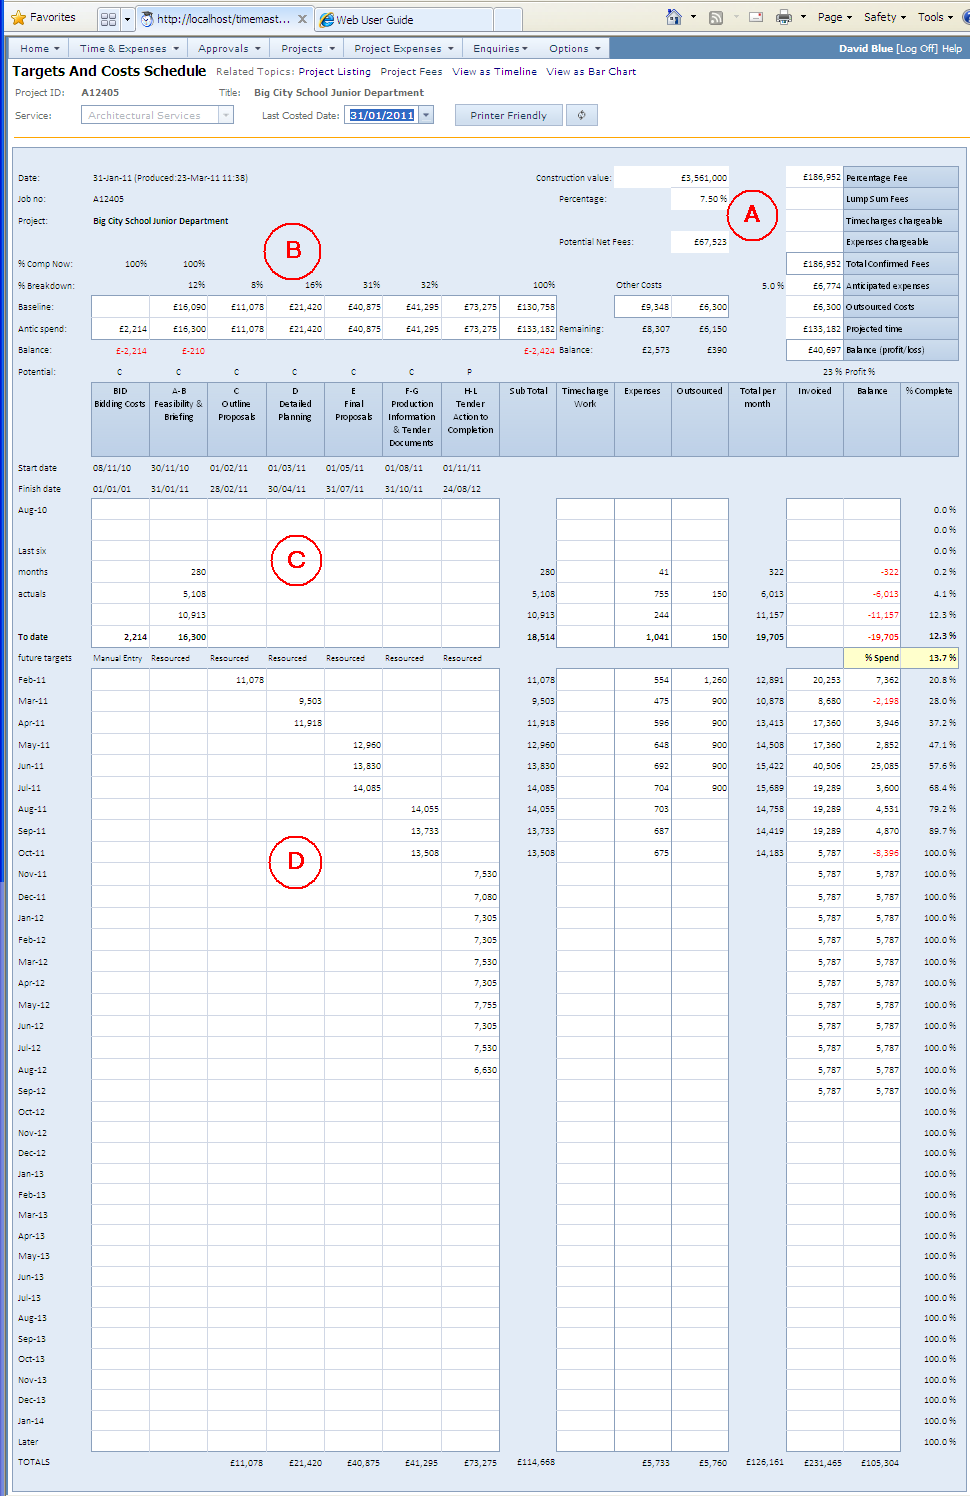
Calculation Logic
More detail on how profitability is calculated is given in the topic: How Income and Cost Profiles are Calculated.
Table A
This section describes the total and headline figures for the service.
Date
|
Above the Job No, this is the Last Costed Date and is the date up to which actual costs are reported and after which actual costs are replaced by forecasted costs. |
Construction Value
|
Latest project value |
Percentage |
Fee percentage for the service
|
Percentage Fee
|
The percentage fee for the service (Construction value x Fee Percentage) |
Lump Sum Fees
|
Any additional fixed fees allocated to tasks |
Timecharges Chargeable |
The value of time-charges chargeable up to the Last Costed Date.
|
Expenses Chargeable |
The value of expenses chargeable up to the Last Costed Date.
|
Total Confirmed Fees |
The total of: Percentage Fee + Lump Sum Fees + Timecharges Chargeable + Expenses Chargeable
|
Anticipated Expenses |
This is the sum of Expense Costs To Date plus Forecasted Expenses. Expense costs to date is the cost on the To Date row under the Expenses column, Forecasted Expense Costs is the cost on the TOTALS row (at the bottom) under the Expenses column.
|
Outsourced Costs |
The value of outsourced costs against confirmed (i.e. not speculative) tasks.
|
Projected Time
|
This is the sum of time costs to date plus forecasted time costs. Time costs to date is cost on the To Date row under the Sub Total column, Forecasted time cost is the cost on the TOTALS row (at the bottom) under the Sub Total column.
|
Potential Net Fees |
Total internal fees marked as speculative.
|
Table B - Tasks
This section describes the headline figures for each task and non-fee related costs. It describes the fields starting with the task name column upwards.
Task Headings |
Lists all fixed fee tasks along with the task code and name. The left hand table contains only fixed fee tasks. |
% Comp Now |
The calculated percentage spend based on target costs as follows: (Actual cost + Forecast cost) / Actual cost In most cases this will relate to the percentage complete, but effective for the date of the report, except where user enter a percentage complete based on a fee claim rather than the work carried out.
|
% Breakdown |
This is the percentage each task contributes to the overall total in relation to its baseline target figure. For example, If a project comprises two tasks; Task A Baseline Target = £4,000 Task B Baseline Target = £6,000 Then Task A contributes 40% and (regardless of how much has been spent, if the task is 100% complete then the project is 40% complete overall)
|
Baseline |
The baseline target. If no baseline target has been entered, then the current target is used as the baseline. If no baseline or current target has been entered, then this figure will be zero.
|
Antic Spend |
This is the actual cost for the task, plus forecasted spend. i.e. To Date row + TOTALS row |
Balance |
Baseline – Antic Spend |
Potential |
Indicates whether the task is speculative or confirmed: P = Potential work (Speculative) C = Confirmed work
|
Start Date |
The target start date for the task
|
Finish Date |
The target finish date for the task
|
Sub Total Column |
The Sub Total column contains totals for all confirmed fixed fee tasks. Costs against potential tasks are shown, but not included in the totals.
|
Table B – Other Costs
Timecharges |
The timecharges column does not contain any figures for baseline or anticipated spend |
Expenses Baseline |
The value in the Expenses column, Baseline row is the total fixed fee value multiplied by the non chargeable expense percentage for the service. Total Fee x % Non chargeable expense allowance
|
Expenses Remaining |
Expenses Baseline – Expenses Spend to date |
Expenses Balance |
Expenses Baseline – Anticipated Expenses Spend The Anticipated Expenses Spend is the actual spend on expenses to date plus Forecasted Expense Cost. The Forecasts Expense Cost is the Forecasted time costs to complete multiplied by the % Non Chargeable Expense Allowance. This will obviously result in a difference in the early days as the % non chargeable expense allowance is applied to firstly the fee value and secondly the target value. Once the project is under way the remaining cost to complete is a more accurate method of forecasting expense costs.
|
Outsourced Baseline |
The value of outsourced fees on confirmed tasks only.
|
Outsourced Remaining |
The actual cost of expense payment submitted against outsourced fees
|
Outsourced Balance |
The difference between outsourced payments schedule to the Last Costed Date and paid to the Last Costed Date. Not all organisations schedule their outsourced payments so this figure is only relevant for organisations which schedule outsourced payments.
|
Table C - Tasks
Last 6 months actuals |
Actual costs from timesheets for the past 6 months
|
To Date |
Total actual costs from timesheets at the resource rate up to the Last Costed Date.
|
Table C – Other Costs
Last 6 months actuals |
Actual costs for the appropriate heading: Sub Total – actual costs from all fixed fee confirmed tasks Timecharges – actual costs from timecharged stages. Expenses – actual costs from expenses. Outsourced – actual costs from expense payments against outsourced fees. Total per month – Total actual costs for all items (time + expenses + outsourced) Invoices – actual invoices Balance – Invoices – Total costs per month % Complete – Percent spend based on targeted tasks only ie Actual cost / (Actual + Anticipated Spend) calculated for fixed fee tasks only. |
To Date |
Total actual costs for the appropriate heading up to the Last Costed Date. Sub Total – actual costs from all fixed fee confirmed tasks Timecharges – actual costs from timecharged stages. Expenses – actual costs from expenses. Outsourced – actual costs from expense payments against outsourced fees. Total per month – Total actual costs for all items (time + expenses + outsourced) Invoices – actual invoices Balance – Invoices – Total costs per month % Complete – Percent spend based on targeted tasks only. Ie Actual cost / (Actual + Anticipated Spend) calculated for fixed fee tasks only.
|
Table D – Tasks
Future targets |
This row shows how each task has been targeted. This provides an indication to the accuracy of the forecasted values. Resourced: Values are taken from resource plans Scheduled: Values are taken from scheduled targets Link to Fee: Values are taken from the fee less a profit margin and spread over task start and finish dates Manually: Values are manually entered and spread over task start and finish dates |
Monthly figures |
The monthly figures contain the forecasted amounts for each month according to the target method shown above. Resourced: Monthly values are taken from the resource plans Scheduled: Monthly values are taken from the task schedules Link to Fee: Values are taken from the fee less a profit and spread evenly over the task start and finish dates. Manually: Values are taken from a manually entered total task target spend and spread evenly over the task start and finish dates.
|
Table D – Other Costs
Monthly figures |
The monthly figures contain the forecasted amounts for each month for the appropriate column. Timecharges: These are calculated for each task according to its target method. Ie. From resource plan or spread evenly over the task dates as described above. Expenses: This is the value of the Sub Total column (total forecast for all fixed fee confirmed tasks) multiplied by the non-chargeable expense percent for the service. Outsourced: There are two methods of forecasting monthly outsourced fees. • By entering a schedule of payments
Invoiced: Forecast invoice values come from either an invoice schedule or a straight line apportionment of the fees over the task dates.
|
||
% Complete |
The % complete is calculated for each month from the forecasted cost up to the month in question divided by the forecasted spend to the end of the project. The forecasted values are calculated from the confirmed fixed fee tasks only. |