Target Graph
The Target vs Actuals Graph is obtained by clicking on the Reports menu within the Projects Listing page.
(Click here to see a picture of the menu location)
Access Right: Project Targeting View in Web
The Project Target Graph is only available if the Project Management module is installed.
Purpose
The Target Graph provides a graph of actual and forecast timesheet expenditure on a project or a service. It allows the rate of expenditure to be easily visualised in a graphic format against a time line.
The graph may be produced for the whole project or an individual service.
Note that if start and finish dates are not entered for tasks, it may be impossible to create a sensible graph.
This topic contains
• Instructions on how to operate the Profitability Timeline Graph
| • | Screenshot of the Profitability Timeline Graph |
| • | An explanation of how the graph values are calculated |
Operation
To access the Target Graph, select the Target Graph option under the Planning menu in the Project Listing page. To obtain the Project Listing page, select the Project Listing option from the top Projects menu.
The graph is available for a selected service on a project or for the project overall. This is controlled by the Service to Graph drop-down.
The Last Costed Date defines the effective date at which costs are taken from the timesheets or forecasted costs.
The Dates range of dates allows you to draw the graph for a range of dates. If left blank the graph will be drawn from the earliest expenditure/income to the latest expenditure/income.
For example, a date of 31-Jan-11 indicates that actual costs are taken from timesheets prior to 31-Jan-11 and costs after 31-Jan-11 are taken from the forecast.
If either the Service or Last Costed Date or Date Range is changed you need to click the Refresh button ![]() to refresh the graph.
to refresh the graph.
The colours and style of the graph can be changed using the Chart Appearance and Chart Palette options above the graph.
Screenshot
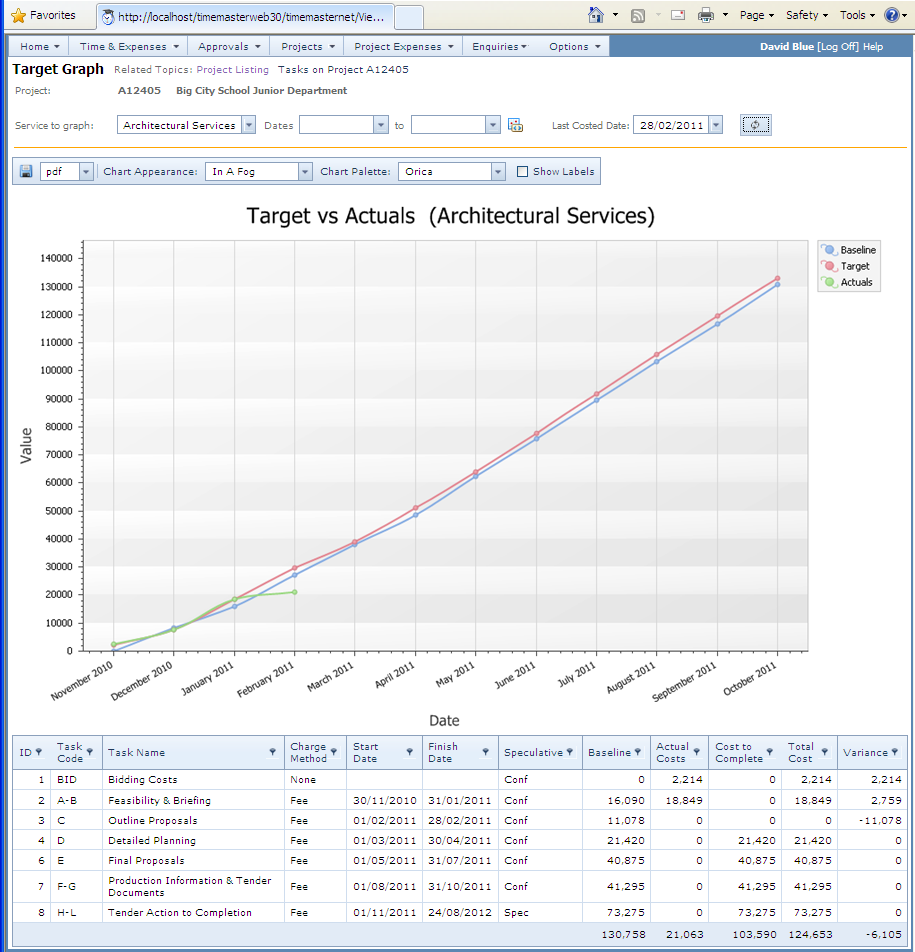
Calculation Logic
Graph
The graph contains three lines:
Baseline |
This line shows the latest baseline targets straight line apportioned between the start and finish dates for each task. If the task has no start and finish dates the graph portion for that task will be missing. If there is no baseline saved for any task, then the current target is used and straightlined in the same way. |
Target |
The target shows either: The values from resource plans if the task is targeted using resource plane, or Straight line apportionment between the task start and finish dates if not. |
Actual Costs |
The line plots the actual costs from timesheets against the timesheet dates.
|
Tasks Table (below the graph)
ID |
Defines the planning order of the task |
||||
Task Code |
Task Code |
||||
Task Name |
Name of the task |
||||
Charge Method |
Defines how the task is to be charged |
||||
Start Date |
Target start date for the task |
||||
Finish Date |
Target finish date for the task |
||||
Speculative |
Defines whether the task is speculative or not: Spec = Speculative Conf = Confirmed |
||||
Baseline |
The baseline target for the task. If the baseline is zero the latest target figure is used. The baseline is straight-lined between the task start and finish dates |
||||
Target Line |
The target line is the anticipated target cost. This is not shown in the table but is drawn on the graph for comparison with the actuals. If the target method for the task is Resource Plan, then the curve is drawn from the resource plan (including historically) If the target method is any other the line is drawn using a straight line apportionment between the task start and finish dates. |
||||
Actual Cost |
Actual costs from timesheets up to the Last Costed Date. |
||||
Cost to Complete |
The cost to complete for time related costs is taken from one of: • Resource Plans for tasks set for resource planning
|
||||
Total Cost |
Actual Cost + Cost to Complete
|
||||
Variance |
Baseline – Total Cost |