Expense Analysis
Navigation: |
Reports > Timesheet Reports > Expense Analysis |
Access Right: |
Timesheet Functions > Timesheet Cost Enquiries > Expense Analysis |
Purpose
The Expense Analysis gives valuable reporting of staff and/or project expense cost and charge data. For example, you can create analysis and graphs of expenses recorded by group, to project classifications or clients. The report itself returns the Expense data in a tabular format similar to a pivot grid.
Additional Information
|
Item |
Description |
Show Subtotals |
If this it ticked a sub total for each Outer Row will be shown. This is therefore only applicable when an Outer Row is selected. |
Show Percentages |
If this is ticked a percentage column in included in the data to shown the percentage for each summary column. |
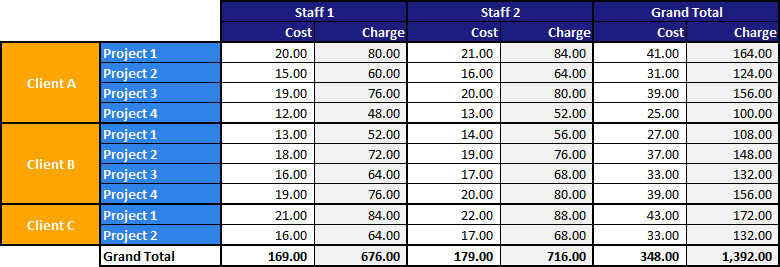
The Expense Analysis requires three items, with a fourth optional:
Option |
Example setting |
Field(s) to summarise (analyse): |
Show Costs Show Charges |
Column: |
Staff |
Row: |
Project ID |
Outer Row: |
Client |
The following example shows how the data is returned based on a example criteria above.

Buttons at the top
|
Click to load a previously saved definition. |
||||||||||||
|
Click to save the selections and grouping so you can re-use the report later. |
||||||||||||
|
Allows you to select which type of expense lines should be included in the report.
|
||||||||||||
|
Clears any selections made |
||||||||||||
|
Allows complex filters to be applied. Filtering Lists is explained in its own help topic |
||||||||||||
|
Exports the grid to Excel |
||||||||||||
|
Loads the charting option for the report |
||||||||||||
|
Resizes the grid after you have altered the size of the browser window |
||||||||||||
|
Refreshes the grid |
Charting Options
Once the report has been produced, the results may be loaded into a chart. This may have limited use, and works best with a small amount of data.
Type |
Defines the type of chart. You will need to experiment to find a chart which suits the column/row layout you have chosen |
Appearance |
Changes the colour scheme for the chart |
Title |
Allows the title to be edited |
Show Labels |
Shows the labels (values) next to the chart |
|
If any of the above items are changed, you need to Refresh the chart to see the results |
|
Prints and exports the chart. The format for the export is selected from the drop down. |