Home Page
Navigation: |
Home > Home Page |
Access Right: |
None |
Purpose
The Home Page is where all users land when logging into Timemaster. It provides a quick view of the key information the user feels important to them.
The Home Page is split by Tab Pages. Each tab page can show several different widgets.
The user can be add, remove or rename Tab pages. They can also add and remove any of the Widgets on the tab pages (this is covered in the Operation section below).
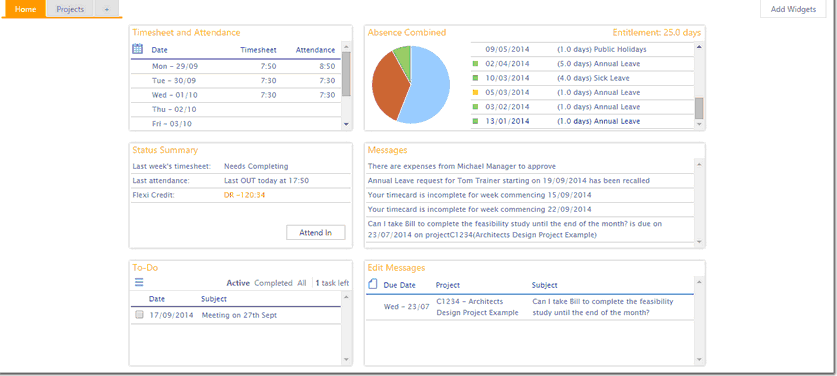
The image below shows a typical Home Page within Timemaster. Do not worry if your screen differs slightly to that shown below. The exact layout will depend on your Timemaster permissions and system configuration.
Home Page
Widgets
Note: You can re-size widgets by moving your mouse pointer to the bottom right of the widget, clicking, then dragging. The widget will then re-size to the nearest appropriate size. |
|
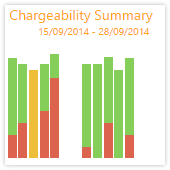
The Chargeability Summary shows how much time has been booked to;- ▪Chargeable Projects (green), ▪Non-Chargeable Projects (red), ▪Overhead projects (orange) over the last two weeks. You can hover your mouse over the graph to obtain a more detailed breakdown of the time booked. The Chg. Target will be shown as a linear line across the chart for target performance comparison. This setting is defined on the Staff Employment Details page. |
|
|
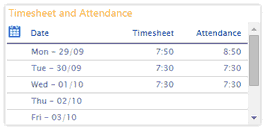
The Time and Attendance widget shows a summary of your current weeks time and attendance.
Please note that this widget will customise itself subject to your Timesheet preference and Attendance type settings. i.e. if you are not configured to enter flexitime the Attendance column will not be shown.
You can jump directly to your Timesheet or Timecard by clicking either of the columns. |
|
|
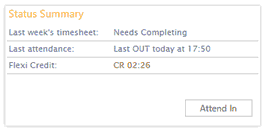
The Status Summary widget shows the status of your current timesheet. If you are required to fill in a flexi card your current flexi balance will also be shown. You can also attend in and out directly from this widget by clicking the Attend In / Attend Out button. |
|
|
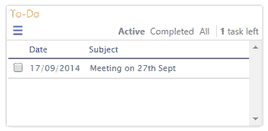
The To-Do widget interacts with My Diary. It shows all diary entries which have the option ‘show in to-do list’ ticked. Entries which are overdue are show in red text. You can add new actions by clicking the menu button in the top left corner of the widget. You can mark actions complete by placing a tick to the left of the action. When an action is marked as complete it disappears from the 'Active' list. You can click the 'Completed' option at the top of the action list to display completed actions. |
|
|
Access Rights: ...Web Application Functions > Flexi-time Functions > Absence > Absence Requests
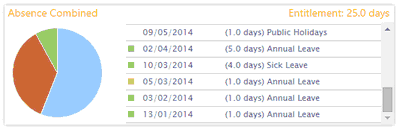
The Absence Combined provides a quick breakdown of your absence bookings. Clicking on any of the absences takes you to your Absence Requests page. The pie chart on the left shows a summary of your holiday absences as follows;- ▪Taken (red) ▪Approved (green) ▪Remaining (blue) You can hover your mouse over the pie chart to shown the specific values. Please note that requested leave is not included in the pie chart. |
|
|
Access Rights: ...Web Application Functions > Flexi-time Functions > Absence > Absence Requests
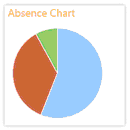
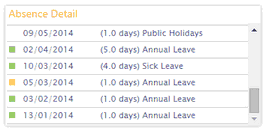
Absence Chart and Absence Details widgets These are a cut-down versions of the Absence Combined widget (above). |
|
|
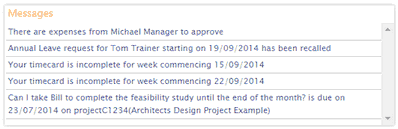
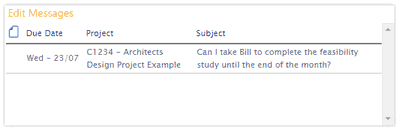
The messages widget contains your messages. These will be setup by your system administrator and may include: •Notification of missing timesheets •Notification of approvals •Warnings when project targets may be exceeded •Warnings when task dates are not achieved Messages sent from other users will also appear in this list. See Edit Messages widget below. |
|
|
Refer to Sending Messages to Other Users for details. |
|
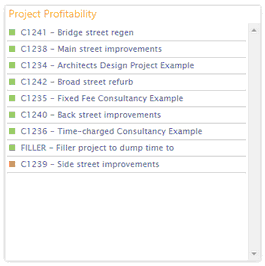
Project Specific widgets
|
Access Rights: ...Web Application Functions > Project Related Functions > Project Views and Reports > •Project Profitability View in Web •Project Targeting View in Web •Project Limit View in Web
There are a total of twelve project widgets. These are used to give Project Managers instance visibility of project performance. Each project acts like a hyper-link to its own data.
If you are a multi-discipline orgainisation (you use more than one service) the Service Filter option will appear next to the Add Widget button when a widget page has a project widget present. This allows you to filter the project widgets by a specific service.
|
Operation
Adding Widgets
You can add additional widgets as follows;-
1.Click the 'Add Widgets' button in the top right corner
2.Selecting the desired widget
3.Dragging the widget onto the Home Page canvass.
Removing Widgets
You can remove widgets from the Home Page canvass as follows;-
1.Move your mouse pointer over the top of the widget - the pointer icon will change to a cross
2.Click the left mouse button and drag the widget over the orange banner which has appeared at the top of the page.
|
Adding Tab pages
New tab pages can be added by clicking the + tab to the right of the Home and Projects tab pages.
Renaming Tab pages
You can rename the tab page caption by double clicking the tab page and entering the new caption.
Deleting Tab pages
You can delete a tab page from the Home Page canvass as follows;-
1.Double click the tab page as if you were renaming it
2.Click the black 'bin' icon to the right of the rename label.
|
|
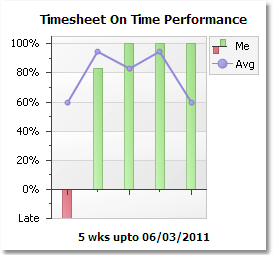
The Timesheet-On-Tiime-Performance graph compares your timesheet submission dates with the average for your group. A timesheet submitted on time (often the following Monday) scores 100%. Each day late decreases your percentage score, up to a maximum allowed lateness after which it is considered late and scores negative. For example, if the timesheet is due the following Monday and after the Monday following that is considered late, then the following scores would apply. Timesheet submitted on Monday or before: 100% Timesheet submitted on Tuesday: 6x 100% / 7 = 86% Wednesday: 5 x 100% / 7 = 71.4% Week on Monday: 1 x 100% / 7 = 14.2% After a week on Monday the timesheet is considered late and allocated a negative score of: -20% |
|
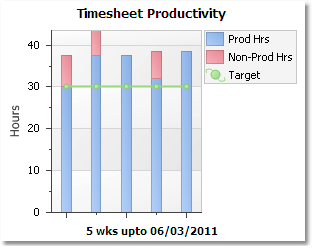
The Timesheet Productivity graph shows the number of hours (in a week) which is being attributed to productive projects. This is compared to the target productivity which has been set for you. In a week which contains absence booking such as sick leave or holiday, this will be down, whereas in a week with no admin or absence time this will be 100%. |