Project Time Analysis
Navigation: |
Reports > Project Reports > Project Time Analysis Report |
Access Right: |
Reports > Project Enquiries > Project Time Analysis |
Additional Access Rights: |
Any of the staff related timesheet enquiry options will also provide access to this report, and provide access to the relevant project information. ▪View all records in timesheet enquiry ▪View my involvement in timesheet enquiry ▪View timesheet enquiry as project leader/service leader ▪View timesheet enquiry using project groups |
Purpose
The Project Time Analysis Report shows a breakdown of time spent to projects against two user-defined headings. This report allows a major and minor grouping to be selected, along with a range of dates.
For example,
Selecting Project as the major grouping and Activity as the minor grouping will give a pie chart for each project and show the percentage project time from each activity.
Selecting Client as the major grouping and Staff Name as the minor grouping will give a pie chart for each client and show the percentage of the total time contributed by each staff member.
The report shows the figures from different currencies in separate groupings. |
Operation
The report initially shows one line per major grouping.
Click on the arrow in the first column to expand each line as required. When expanded, the detail will be shown with a pie chart for each major line.
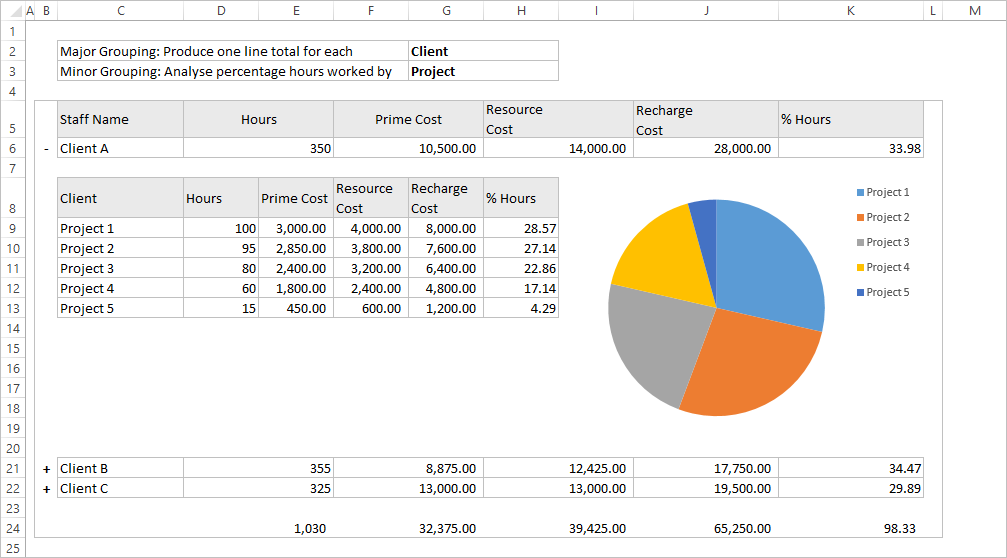
Sample Report
The report below shows example data based on a Major Grouping of Client and a Minor Grouping of Project.
Calculations
All figures are based on timesheet values between the dates specified.
Item |
Description |
Hours |
The number of hours staff have booked to the clients projects. |
Prime Cost* |
The sum of the Prime Cost values stored against the staff member's timesheets booked to the client. |
Resource Cost* |
The sum of the Resource Cost values stored against the staff member's timesheet booked to the client. |
Recharge Cost* |
The sum of the Recharge Cost values stored against the staff member's timesheet booked to the client. |
% Hours |
The hours booked to the clients projects as a percentage of the total number of hours from all the staff on the report. (Cell K6 = 350/1030*100) |
|
Related Topics