Project Targeting View
Navigation: |
Project Listing > Targeting View |
Access Right: |
Project Related > Project Targeting View in web |
Purpose
The Targeting view provides an overall view of predicted project timesheet costs compared to a baseline. Users who resource plan may also add additional columns to the grid to compare actual hours booked through the timesheet to the planned hours. This indicates which projects whose resource plans may require updating.
Additional Information
Project VisibilityBy default this view only shows projects from your favourites list. This is because the view combines a lot of data from income schedules, timesheets and resource plans and can take a long time to produce. However, if you want to view all projects* you have visibility of in this view without it restricting to your favourites you can request this from your system administrator. They will need to change the Restrict Web Project Views setting on the Control Parameters > Additional Projects tab page. They will then need to grant your user record the Restrict Project Views to Favourites user option via the System Administration > Allocate User Timesheet Options > Web Options tab page. Please note that the users access right restrictions which limit the user to 'My Project Set' or As Project Leader' still apply. *Excluding projects marked as overheads. |
Projects you are a project leader or deputy for are always added to your favourites, as are projects you book time to. To add and remove projects from your favourites list, use the Manage Favourites option under the Home menu.
You may need to customise this view to show the columns you require using the customise columns facility. See the table below for a description of each field.
Column |
Description |
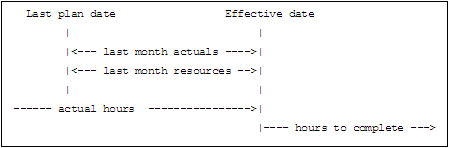
Effective Date |
This is not a column in the report but a date which you can enter. It defines the date up to which costs are taken from timesheets and invoices and after which costs are calculated from resource plans or forecasted task dates. |
Columns initially visible by default: |
|
Baseline Hours |
Total baseline hours for non speculative tasks If the baseline has not been used, the current target hours are used instead. |
Actual Hours |
Actual costs from timesheets up to the Effective Date shown at the top. |
Hours to Complete |
All costs required to complete the project. These are calculated for each task and accumulated for the project overall. The cost to complete comes from: ▪Resource plans for dates ahead of the effective date ▪Remaining targets for those tasks which are not resource planned ▪Cost to complete against tasks marked as speculative are not included in this figure.
When resource planning is in use, the Hours to Complete field shows the hours from future resource plans from the effective date at the top. If staff haven’t recorded actual hours in accordance with the plan, then the hours to complete may not provide the figure you are looking for, and you may be better off using the Target Hours Remaining field. |
Total Hours |
Cost to Date + Cost to Complete |
% Complete |
Actual Hours / (Actual Hours + Hours to Complete) Ie this is actually the % spent, not the project leaders assessment of % complete |
Variance |
Baseline Hours – Total Hours |
Columns initially hidden but available using the Customise Columns facility |
|
Target Hours |
The target hours allocated to the task. |
Target Hours Remain |
A simple arithmetic calculation of Target Hours less Actual Hours. This may be more use to you than the Hours to Complete figure as it is simply the original target hours set for the task less actual hours booked. |
Planned Date |
The last date the project resource plan was updated. This column is only relevant for organisations using the resource planner and is hidden by default. |
Last Month Actuals |
The number of hours resourced within the time period between the Last Plan Date and the Effective Date at the top |
Last Month Resources |
The number of hours booked to timesheets within the time period between the Last Plan Date and the Effective Date at the top |
Last Month Difference |
The difference between the above two figures; Actual and Resourced. This shows the comparison between the resources planned and actually booked through timesheets cince the last plan date. If this is a large figure it indicates the resource plan is out of date and should be re-visited.
|
Last Task |
The last incomplete task This is task with the latest target finish date which is not complete. If all historic tasks are complete, then the next task due to finish is shown. The date is measured from the effective date at the top of the grid. |
Finish Date |
The target finish date for the above task |
Days Remaining |
The number of days remaining from the effective date to the last task finish date. A negative number indicates the task is late in finishing. A positive number indicates the remaining time to finish the task. |
Detail Reporting
More detailed reports are available showing targeting figures in more detail, and graphically.
To view the profitability for a project in more detail:
1.Select the project you wish to report on.
2.Click the ![]() button.
button.
3.Select one of the reports under the Reporting menu.
The following detailed reports are available:
Shows a graph of actual and forecast timesheet expenditure on a project or a service. |
|
Shows a list view of all targetable or time-bookable tasks for the project and shows the actual costs compared to baseline and estimated costs. |
|